

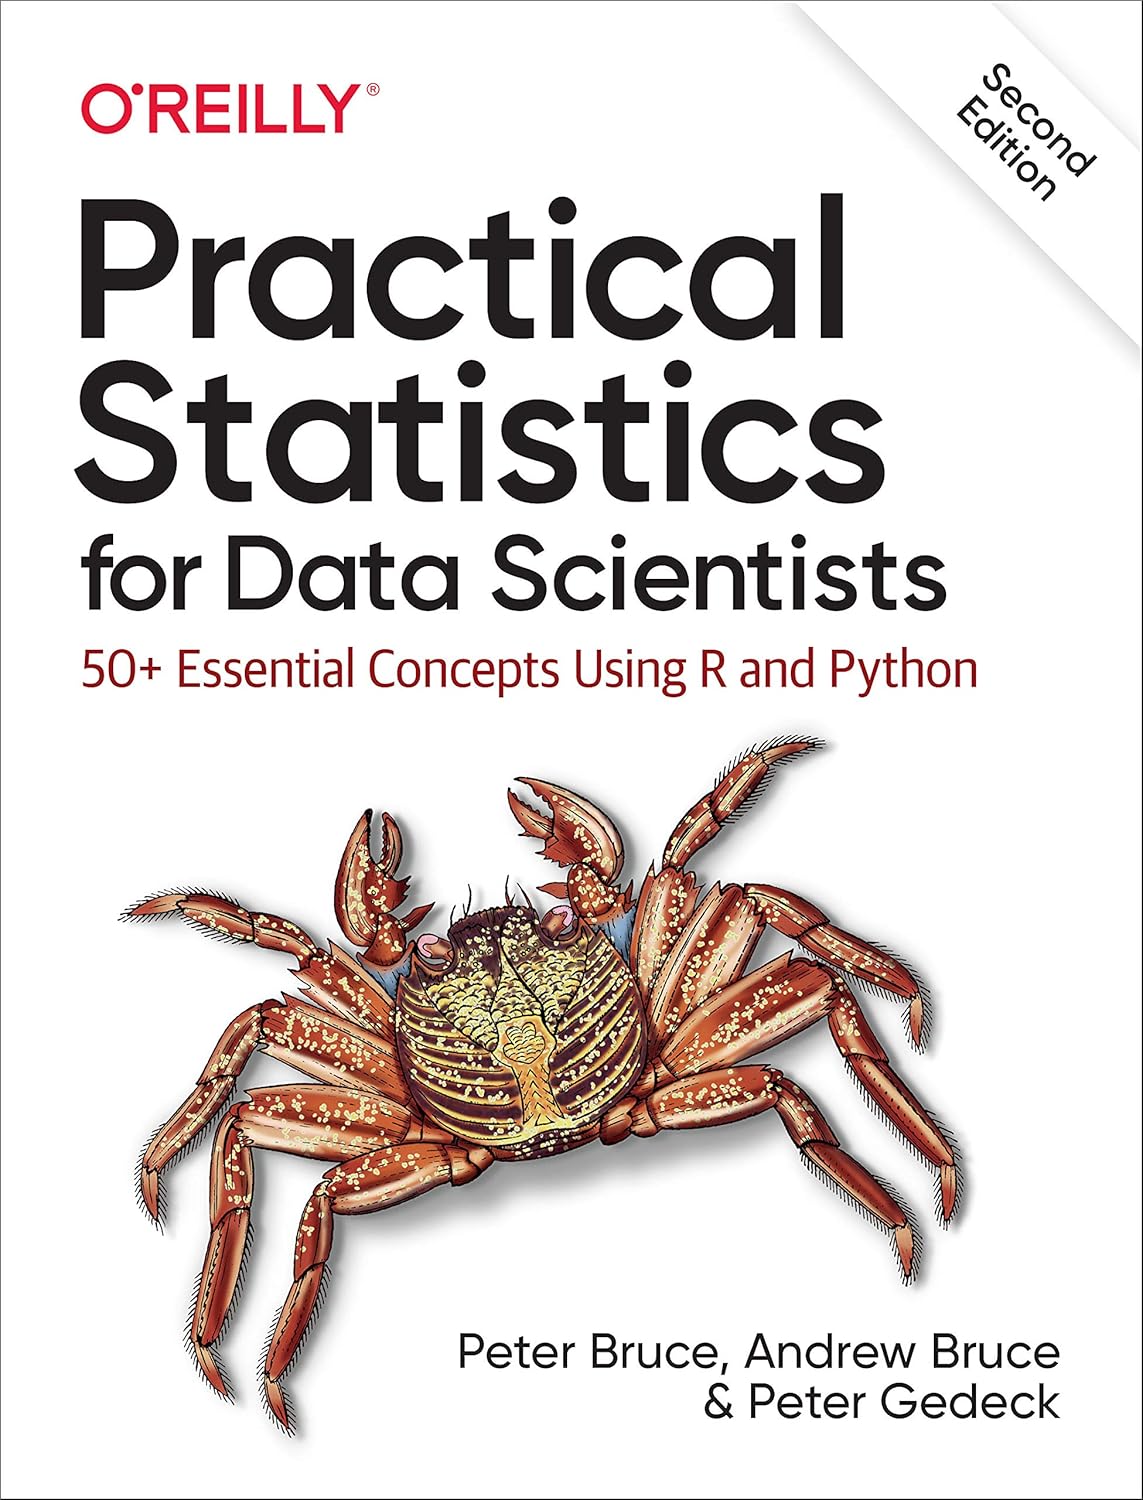
About Practical Statistics for Data Scientists: 50+ Essential Concepts Using R and Python by Peter Bruce, Andrew Bruce & Peter Gedeck – A Clear Guide for Real Data Work
If data feels easy until numbers, charts, models, and statistics appear, this book is made to close that gap. Practical Statistics for Data Scientists: 50+ Essential Concepts Using R and Python by Peter Bruce, Andrew Bruce & Peter Gedeck explains the statistics that data scientists use in real work without turning the subject into a wall of hard theory. It gives you a practical path from basic data checking to more useful ideas such as sampling, experiments, regression, classification, and machine learning.
The book is written for people who want to understand what the numbers mean and what to do with them. Instead of asking you to memorize many formulas, it connects each idea with data work and shows how statistical thinking supports better choices. The second edition also uses both R and Python, so readers can see how the same idea works in two popular data science languages.
For students, new analysts, programmers, researchers, and working data people, this is the kind of book that can stay near your laptop. You can study it from start to finish, or open the chapter you need when a task becomes confusing.
Turn confusing statistics into useful data skills
Many people learn Python or R first and then discover a new problem: knowing code is not the same as knowing what a result means. A program may calculate an average, build a chart, fit a model, or return a score in seconds. But a data scientist still has to ask better questions. Is the data clean? Is the sample fair? Is the difference real or just random? Is the model useful? Are we measuring the right thing?
It starts with ideas that appear again and again in data work, then moves toward methods used for prediction and decision making. The explanations are focused on use. That makes the book easier to connect with projects, classes, reports, notebooks, and real business questions.
You do not need to become a pure statistician to use statistics well. You need enough clear knowledge to choose a method, read its result, notice common mistakes, and explain what the result means. That is the main value of this book.
See your data clearly before you build a model
Good data work begins before machine learning. The book spends time on exploratory data analysis because simple checks can reveal problems that a complex model may hide. You learn how to think about common data types, tables, averages, medians, variation, percentiles, frequency tables, histograms, density plots, correlation, and relationships between variables.
These tools sound simple, but they answer important questions. What is normal in the data? What values are unusual? How wide is the spread? Are two variables moving together? Is one group very different from another? Is the shape of the data balanced or heavily pulled to one side?
Learning to ask these questions gives you a stronger base for later work. It also helps you avoid making a model too early. A clear chart or summary can often show a mistake, a strange value, or a pattern before hours are spent coding.
Learn how sampling and chance affect your conclusions
Data is often only a piece of a larger world. A survey uses some people, not everyone. A test uses some customers, not every future customer. A model learns from one data set and is expected to work on new data. Because of this, chance and sampling matter.
Practical Statistics for Data Scientists explains useful ideas around random sampling, bias, standard error, confidence, resampling, bootstrap methods, and distributions in a practical way. These topics help you understand why two samples from the same population can still give different results.
This matters in real decisions. A number can look exact on a screen while still being uncertain. By learning where uncertainty comes from, you can avoid treating every output as a fact. You become better at asking how much trust a result deserves and what extra data may be needed.
Build a stronger base for regression and prediction
Regression is one of the most useful tools in statistics and data science. It can help explain relationships, estimate effects, and make predictions. The book walks through simple and multiple regression, how predictors work together, how to read model output, and where problems can appear.
The goal is not only to fit a line. It is to understand what the model is trying to say. You learn to think about residuals, variables, interactions, model fit, and the difference between a model that looks good on old data and one that performs well on new data.
That knowledge is useful even if you later use more advanced machine learning. Regression teaches habits that carry into many other models: choose features carefully, test performance, question assumptions, and never trust a score without context.
Make classification easier to understand
Many data problems are not about predicting a number. They are about choosing a class. Will a customer leave or stay? Is a message spam or not spam? Is a transaction normal or suspicious? Does a patient belong to a risk group?
The book introduces classification methods and the ideas used to judge them. Readers can learn why accuracy alone may not be enough, especially when one class is rare. Concepts such as probability, cutoffs, sensitivity, specificity, and model evaluation become easier when linked to practical examples.
This is valuable for beginners because classification can look simple from the outside. A model gives a label, but the cost of a wrong label can change from one problem to another. The book helps you think about that decision, not just the code.
Work with both R and Python
One of the strongest practical features of the second edition is its use of both R and Python. R has a long history in statistics, while Python is widely used across programming, analytics, automation, and machine learning. Seeing examples in both languages can help readers move between teams and tools.
You do not have to master both languages before opening the book. If you mainly use Python, you can focus on the Python examples while still learning the statistical idea. If you use R, you can follow the R code and compare how another language handles the same task.
This makes the book useful as both a learning guide and a desk reference. It can also help students who meet R in a statistics course but use Python in personal projects, internships, or data jobs.
What makes this book practical
The book is designed around concepts that appear in real data work. That gives it a direct style. Instead of spending many pages proving formulas, it puts more attention on what a method does, when it is useful, and how it connects to code.
Key strengths include:
- More than 50 important statistical concepts selected for data science work.
- Examples that connect ideas with R and Python.
- Clear coverage of exploratory data analysis and data distributions.
- Practical discussion of sampling, uncertainty, and resampling.
- Useful guidance for experiments and significance testing.
- Step-by-step thinking around regression and prediction.
- Classification concepts that support real decision problems.
- Statistical ideas that connect naturally with machine learning.
- A format that works for both study and quick reference.
These features make the book useful for readers who want less abstract theory and more applied understanding.
Who should read this book?
This book fits many kinds of learners. A university student can use it to make statistics feel more connected to coding. A beginner data analyst can use it to understand the meaning behind common charts and tests. A Python programmer moving into data science can learn why statistical thinking matters. An R user can connect familiar tools with wider data science workflows.
It is also useful for business analysts, researchers, product teams, marketers, engineers, and anyone who works with data and has to explain results to other people.
You will get the most value if you already know a little basic programming or are willing to learn code while you read. You do not need to be an expert mathematician. The book is built for applied learning, so the goal is to make concepts usable.
Use it for study, projects, and everyday data questions
There are several ways to use this book. You can read one chapter each week and practice the examples. You can keep it beside you while building a portfolio project. You can return to a topic before an exam, interview, report, or meeting. You can also use it when a notebook gives a result you do not fully understand.
For example, if two groups show different averages, you can review sampling and testing before making a claim. If a model performs well on training data but poorly on new data, you can return to validation and model error. If a classification model looks accurate but misses an important small group, you can review the evaluation measures that matter.
That makes the book more than a one-time read. It can become a working reference.
A premium reading copy from Bookish Wonderland
A technical book is often opened again and again, so physical reading comfort matters. Bookish Wonderland focuses on a reader-friendly copy with premium eye-soothing cream paper, crystal-clear printing, and high-quality stitched plus glue binding for better durability. These features are useful for long study sessions, frequent page turning, note taking, and regular reference use.
For readers comparing the Book price in Bangladesh for Practical Statistics for Data Scientists by Peter Bruce, Andrew Bruce & Peter Gedeck, this edition offers a way to add a data science reference to your shelf while shopping from a local store.
The clean print helps code, headings, charts, and normal text stay easy to follow. The durable binding is designed for repeated use, which is important for a book you may return to during classes, projects, or work.
Why buy this book from Bookish Wonderland?
Bookish Wonderland is a practical choice for readers who want English books for study, work, and skill building. You get a copy made for comfortable reading and long use, with attention to paper, print, and binding quality.
The store also supports nationwide delivery across Bangladesh, delivery inside and outside Dhaka, cash on delivery, and a fast or urgent delivery option in Dhaka when available. That makes it easier to order a useful technical book without spending time searching from shop to shop.
This title is especially worth adding to your collection if statistics has ever felt harder than coding. It gives you a clearer way to see the ideas behind data science and then apply them with tools you are likely to meet in real work.
Build better data habits from your next project
If you want to stop guessing at statistical terms and start understanding what your data is really saying, Practical Statistics for Data Scientists: 50+ Essential Concepts Using R and Python by Peter Bruce, Andrew Bruce & Peter Gedeck is a smart place to begin.
Use it to study the basics, check ideas during a project, prepare for data work, and build stronger judgment around models and results. The language stays focused on practical use, and the R and Python examples help connect ideas to code.
Add this book to your learning shelf today and give yourself a clearer base for data analysis, experiments, prediction, and machine learning. Order from Bookish Wonderland and start turning statistics from a difficult subject into a tool you can actually use.
If you require any customization or have any questions, please inbox us via FB or Insta.
| Primary Specification | |
| Author | Peter Bruce, Andrew Bruce, Peter Gedeck |
| Editor | David Futato |
| Genre | Data Science, Statistics, Computer Science, Statistical Programming |
| ISBN-13/ISSN | 978-1492072942 |
| ISBN-10 | 149207294X |
| Publisher | O'Reilly Media |
| Publishing Date | June 16, 2020 |
| Edition | 2nd |
| Language | English |
| Format | Printed book |
| Physical Specification & Quality | |
| Paper Quality | Premium eye-soothing cream paper |
| Binding Quality | High quality stitched and glue binding (for longevity) |
| Print Quality | Crystal-clear print |
| Pages | 360 pages |
| Country | USA |
| Logistics Information | |
| Weight | 385 gm |
| Length | 9.8 inches |
| Width | 6.9 inches |
| Height | 0.9 inch |